
The Poisson distribution is widely used to predict the result of a football matches. Multiple articles can be found in the internet and I also already provided a comparison of different Vanilla Poisson models. But the Poisson distribution as some limitations. The Poisson distribution assumes the number of goals a team scores are independent. But everybody watching football knows, that a team being one goals behind is way more motivated to score a goal in comparison to being already 4 goals behind. So let’s have a look how a simple Poisson distribution compares to the actual scored goals.
Continue reading “Poisson vs Reality”Why is it so hard to beat the Bookie?
Image you see following picture for two different profit lines. Both betting simulations are based on the same stacking method: Each identified value bet is set with 1 unit flat stack. Which of both simulation would you prefer? I think the answer is easy.
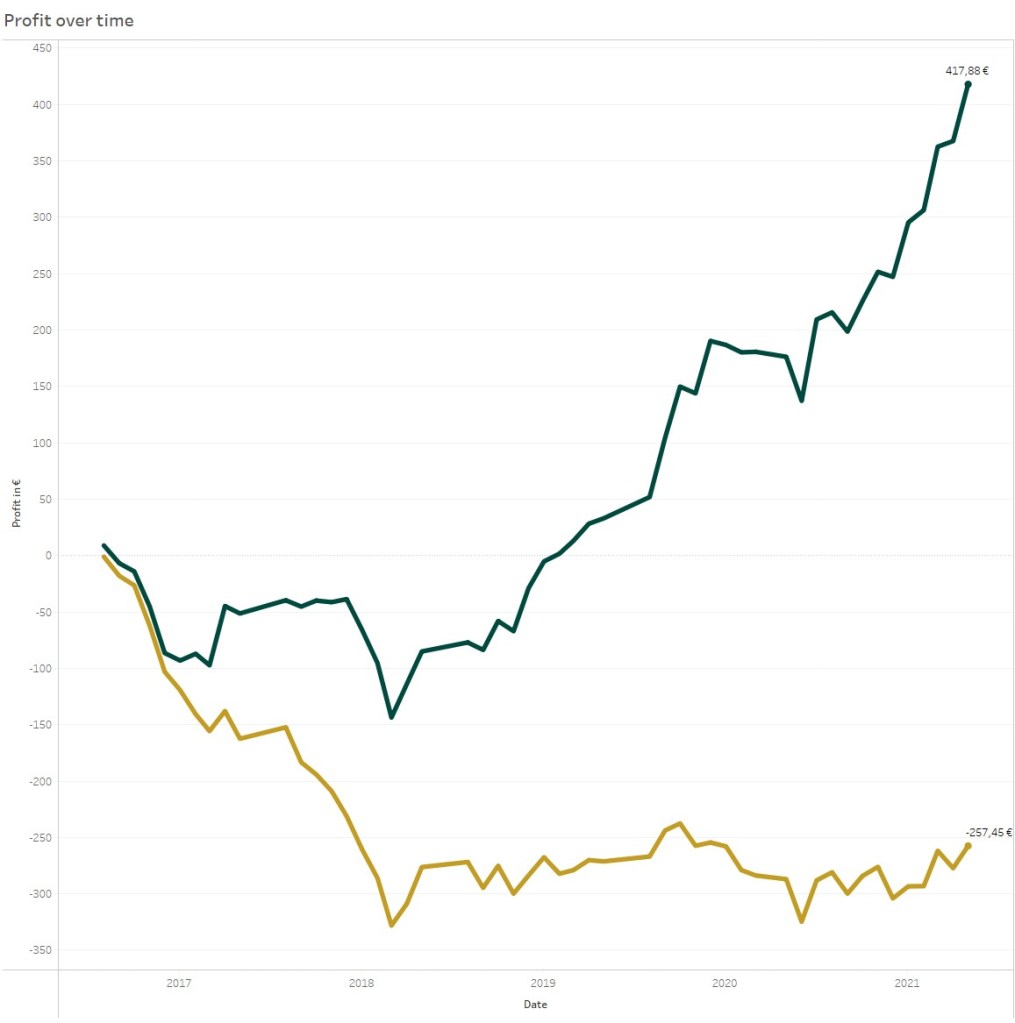
Of course everybody would prefer the green proft line. But both profit lines are based on the same predictive model. All predictions and bet selections are based on the EMA10 Vanilla Poisson xG model, which I already used for multiple blogs.
The difference between both lines: The yellow line represents the betting profit, when betting against the provided odds of a bookie. The green line represent the betting profit, when betting against a bookie without the bookie margin. This bookmaker margin eat up the whole advantage of the model.

You must be logged in to post a comment.