
As the new season kicks off, I’m thrilled to unveil the latest updates to my prediction models, designed to give you an even sharper edge in football betting. Whether you’re a seasoned pro or a passionate hobbyist, my goal is to help you make smarter, data-driven decisions. This season, I’ve made significant enhancements to the Ensemble model, introducing more sophisticated features and expanding market coverage. Let’s dive into the key improvements and see how they can boost your betting strategy for the upcoming matches.
Continue reading “Welcome season 2024/25 – taking a look at the new Ensemble model”Reflecting on the 2023/2024 Football Betting Season: Insights, Challenges, and Future Strategies
With Euro 2024 in full swing and all the football leagues concluded, it’s the perfect time to look back at the past season. This period of reflection is crucial for any serious bettor. Understanding what went well, identifying areas for improvement, and strategizing for the future are key steps to long-term success. The 2023/2024 season was filled with exciting matches, unexpected results, and valuable lessons. In this recap, I’ll break down the performance of my betting strategy, highlight the successes, pinpoint the failures, and discuss the changes I plan to implement for the upcoming season. Let’s dive into the detailed analysis and insights that will shape my approach moving forward.
Continue reading “Reflecting on the 2023/2024 Football Betting Season: Insights, Challenges, and Future Strategies”Season 2023/24 – Did I create a Bet-The-Draw-Machine?
As the football season reaches its midway point, it’s time to take a step back and reflect on the highs and lows of my betting journey. In this blog post, I’ll share my real-life experiences, insights, and lessons learned from the first half of the season. Join me as I navigate the unpredictable world of football betting and explore the strategies that have shaped my approach.
Continue reading “Season 2023/24 – Did I create a Bet-The-Draw-Machine?”Season 2023/24 – Comparing my Mollybet bets with my Ensemble model
Just like every season, I am excited to share my experiences with using different betting models. This year, I have been particularly focused on my ensemble model, which incorporates a diverse range of data and algorithms. Over the first three months of the season, I placed numerous bets, and now I want to take a closer look at the outcomes. I aim to share my insights and analyses regarding these bets. Let’s delve into the realm of sports betting together and explore what we can learn from these initial months.
Continue reading “Season 2023/24 – Comparing my Mollybet bets with my Ensemble model”Inside the BeatTheBookie App – Predicting football matches with an Ensemble model
Not only is it the core feature of the BeatTheBookie app, but it’s also the primary reason why I started developing the app. However, why is this the case, and how does this type of predictive model work for predicting the outcomes of football matches? Let’s delve into it.
Continue reading “Inside the BeatTheBookie App – Predicting football matches with an Ensemble model”Season 2023/24 – A reconciliatory ending
The 2023/24 season has come to an end. This was the first season in which I used my ML Poisson Model and documented the betting results in multiple posts. So let’s take a look at how the overall result of the season turned out.
Continue reading “Season 2023/24 – A reconciliatory ending”Season 2022/23 – The Ligue 1 Disaster
Welcome to my latest blog post, titled “The Ligue 1 Disaster.” As a passionate sports bettor, I’ve been keeping a close eye on the results of my latest betting history over the past month, and one league that has left me utterly disappointed is Ligue 1. Known for its exciting matches and talented players, the French top-tier football league has seen unexpected twists and turns that have turned my betting predictions upside down. In this post, I’ll delve into the recent woes I’ve experienced with my bets on Ligue 1 and analyze the factors that have contributed to what can only be described as a disaster. Join me as I reflect on the surprising outcomes, unforeseen upsets, and the rollercoaster ride of emotions that have made Ligue 1 a source of frustration in my recent betting endeavors.
Continue reading “Season 2022/23 – The Ligue 1 Disaster”Poisson vs Reality
The Poisson distribution is widely used to predict the result of a football matches. Multiple articles can be found in the internet and I also already provided a comparison of different Vanilla Poisson models. But the Poisson distribution as some limitations. The Poisson distribution assumes the number of goals a team scores are independent. But everybody watching football knows, that a team being one goals behind is way more motivated to score a goal in comparison to being already 4 goals behind. So let’s have a look how a simple Poisson distribution compares to the actual scored goals.
Continue reading “Poisson vs Reality”Why is it so hard to beat the Bookie?
Image you see following picture for two different profit lines. Both betting simulations are based on the same stacking method: Each identified value bet is set with 1 unit flat stack. Which of both simulation would you prefer? I think the answer is easy.
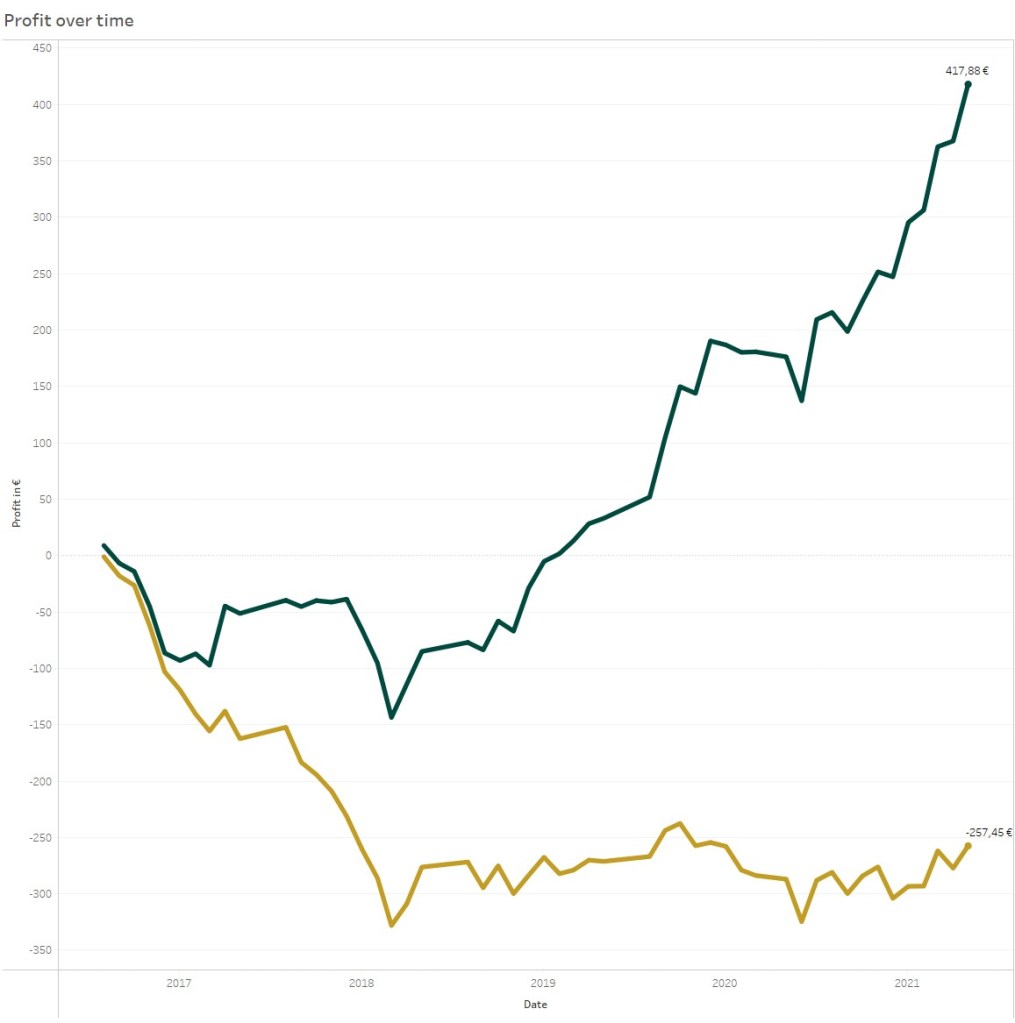
Of course everybody would prefer the green proft line. But both profit lines are based on the same predictive model. All predictions and bet selections are based on the EMA10 Vanilla Poisson xG model, which I already used for multiple blogs.
The difference between both lines: The yellow line represents the betting profit, when betting against the provided odds of a bookie. The green line represent the betting profit, when betting against a bookie without the bookie margin. This bookmaker margin eat up the whole advantage of the model.
The predictive power of xG – Predicting football matches with Expected Goals
“Goals are the only statistic, which decide a match” – sentences like this appeared not only once, while reading discussion about the latest xG statistics of single matches on Twitter. Even if the statistic xG is more and more used by sport journalists and during broadcasts, the meaning and importance of the statistic is not yet widely understood. This might be caused by the usage of xG for single matches or single shots. The final result of a match and the corresponding xG values might differ a lot. But over the long-term xG is a statistic, which tells us way more about a football team than goals and shots alone. To prove this, this post will take a look at the predictive power of xG in comparison to goals. The more information a statistic contains the more it should help us to predict the result of future matches.
Continue reading “The predictive power of xG – Predicting football matches with Expected Goals”
You must be logged in to post a comment.