
Not only is it the core feature of the BeatTheBookie app, but it’s also the primary reason why I started developing the app. However, why is this the case, and how does this type of predictive model work for predicting the outcomes of football matches? Let’s delve into it.
Continue reading “Inside the BeatTheBookie App – Predicting football matches with an Ensemble model”Season 2023/24 – A reconciliatory ending
The 2023/24 season has come to an end. This was the first season in which I used my ML Poisson Model and documented the betting results in multiple posts. So let’s take a look at how the overall result of the season turned out.
Continue reading “Season 2023/24 – A reconciliatory ending”Why is it so hard to beat the Bookie?
Image you see following picture for two different profit lines. Both betting simulations are based on the same stacking method: Each identified value bet is set with 1 unit flat stack. Which of both simulation would you prefer? I think the answer is easy.
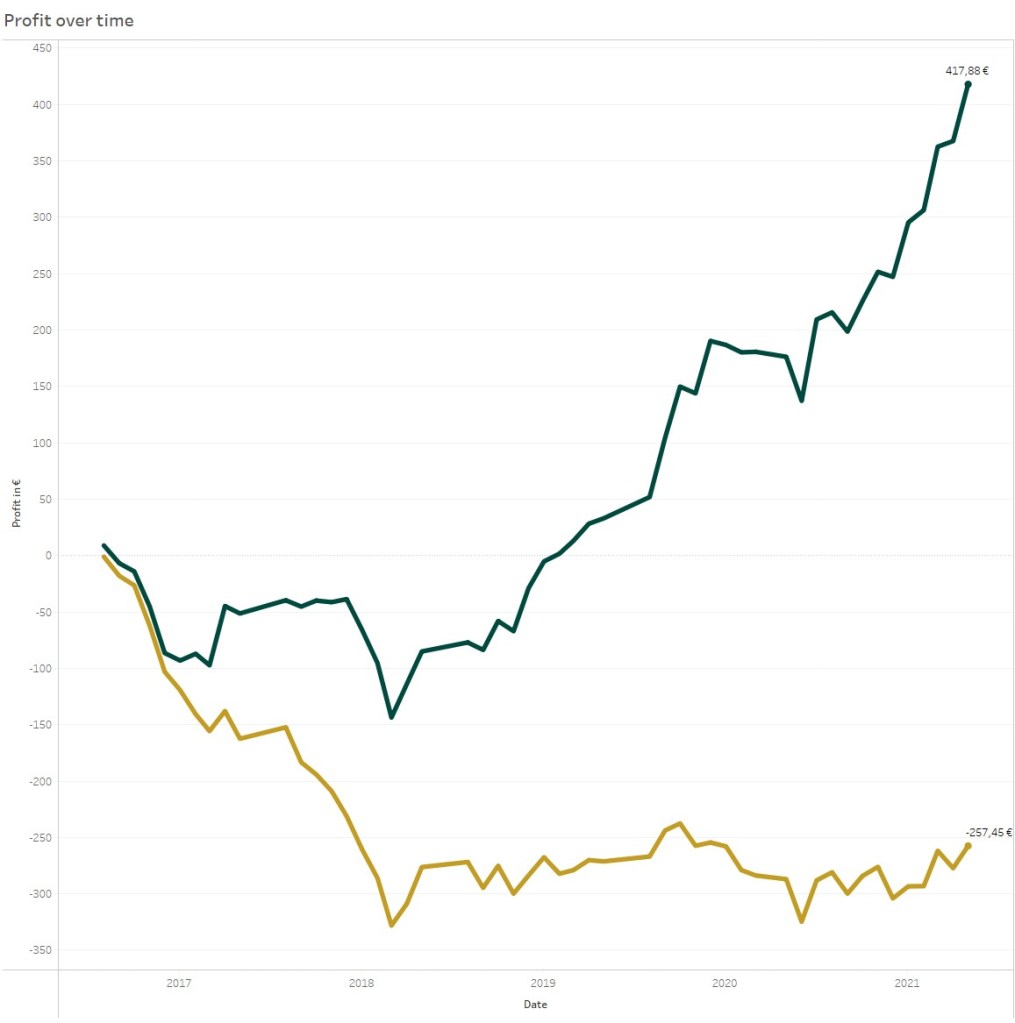
Of course everybody would prefer the green proft line. But both profit lines are based on the same predictive model. All predictions and bet selections are based on the EMA10 Vanilla Poisson xG model, which I already used for multiple blogs.
The difference between both lines: The yellow line represents the betting profit, when betting against the provided odds of a bookie. The green line represent the betting profit, when betting against a bookie without the bookie margin. This bookmaker margin eat up the whole advantage of the model.
xG data journey – the raise of M. Gladbach
After getting all this expected goals data, it’s of course most obvious to take a look at the insights such data can produce and in which way xG can be interpreted. I have decided to take a look at the current development of Borussia Moenchengladbach in the Bundesliga . Even if RB Leipzig took over now the first place, the development of Gladbach in comparison to the last seasons is impressive. And now I just want to know: Does xG data reveals the secret of Marco Rose?
Continue reading “xG data journey – the raise of M. Gladbach”xG data journey – What are ExpectedGoals?
After I realized my available data is definitely not enough to beat the bookie, I decided to start a new data journey and take a look at some more advanced statistics. And what could be better suited as Expected Goals (xG). This statistic is used more and more to explain this specific luck / bad luck factor, you feel, when watching a football match. In the first part of this journey I will explain, what are xG and what they tell you about a football match. Continue reading “xG data journey – What are ExpectedGoals?”
A data journey – market values (part 2)
In the last post I described, how I collected the market value data as the first step of my journey. The second step is – in my opinion – one of the most important ones. Get to know your data! Of course many predictive methods can be used as a black box. But that’s something I would not suggest. At least you should understand how your values are distributed. And it’s even better, when you build some kind of domain knowledge. To know your data offers you the possibility to shorten the training process of you predictive models. And visualizations always help to better understand your data. Continue reading “A data journey – market values (part 2)”
MACD analysis: Man City – Liverpool (03.01.2019)
The 2018/19 season in the Premier League started entirely normal. After a record-breaking season Manchester City was of course favoured to win again the title with Liverpool just having an option as the runner-up. But things changed in December and, according to both coaches, we can expect the match between “the best team in the world” and “the best team in the world”.
So which match could be more usefull to take a look at the MACD analysis for both teams and get a better feeling how this type of analysis can be used to identify the performance trend of a team.
Continue reading “MACD analysis: Man City – Liverpool (03.01.2019)”
Weighted predictor variables and performance trend analysis
The first 10 matchdays of the current season in the Bundesliga revealed some clear disadvantages of my Poisson model. The predictor variables attack and defence strength respond too slowly to performance changes of single teams. This was clearly shown by the loss produced by the poorly performing FC Cologne. A normal SMA (simple moving average) does not use a weight. So latest results, which represent the current form, have not a higher priority over older results. As I looked for solution for this problem I stumbled over the EMA (exponential moving average). This post will explain the use of the EMA and how you can implement it inside the Exasol, so that it is usable as an analytical function for the predictor variables. On top I will show you, how you can analyse the team performance with help of MACD (Moving Average Convergence/Divergence oscillator ).
Continue reading “Weighted predictor variables and performance trend analysis”
Validate model: Poisson distribution (part 2)
In the first part of this post I described, how a Poisson distribution can be used to predict football scores and why it is not sufficient to beat the bookie. The second part will now explain, how I balanced the disadvantages of the poisson distribution. This turned the model to an efficient predictive model, which can be used to gain profit against the bookie.
Continue reading “Validate model: Poisson distribution (part 2)”
Validate model: Poisson distribution (part 1)
The first model I tested is based on the predictive models of Maher [1] and Dixon / Coles [2]. Maher modelled the expected goals for a specific match as two independent Poisson distributions. After that, Dixon / Coles improved this model to balance some disadvantages.
In the previous post I described, how you can easily calculate the features of these models for any football match in the past. The first part of this post will show you, how to calculate the odds with the help of these features and why a simple Poisson distribution is not enough to beat the bookie. How I solved these problems will be the central element of the second part.
Continue reading “Validate model: Poisson distribution (part 1)”

You must be logged in to post a comment.