
As described in How to beat the bookie: Value Betting I want to use Value Betting to beat the bookie. To identify value, I have to be able to calculate the probability of a specific sports event (e.g. Home-Win for Team A) as accurately as possible. Therefor, I have to develop, test, simulate and process different predictive models. As a DWH architect I know, that a good data architecture helps a lot to support such a developing process. That’s why I formed the concept of the TripleA DWH – the Advanced Agile Analytical Data Warehouse – a data architecture aimed to automate data science processes.
Data Vault meets Exasol
The whole concept is a best of breed approach. Data Vault 2.0 is used as the base architecture, modeling method and gets combined with the analytical database Exasol. For the development and processing of the predictive models I use the languages R or Python, which are well known in the Data Science community. This combination offers you some benefits, which I summed up with the 3 A‘s – Advanced, Agile, Analytical.
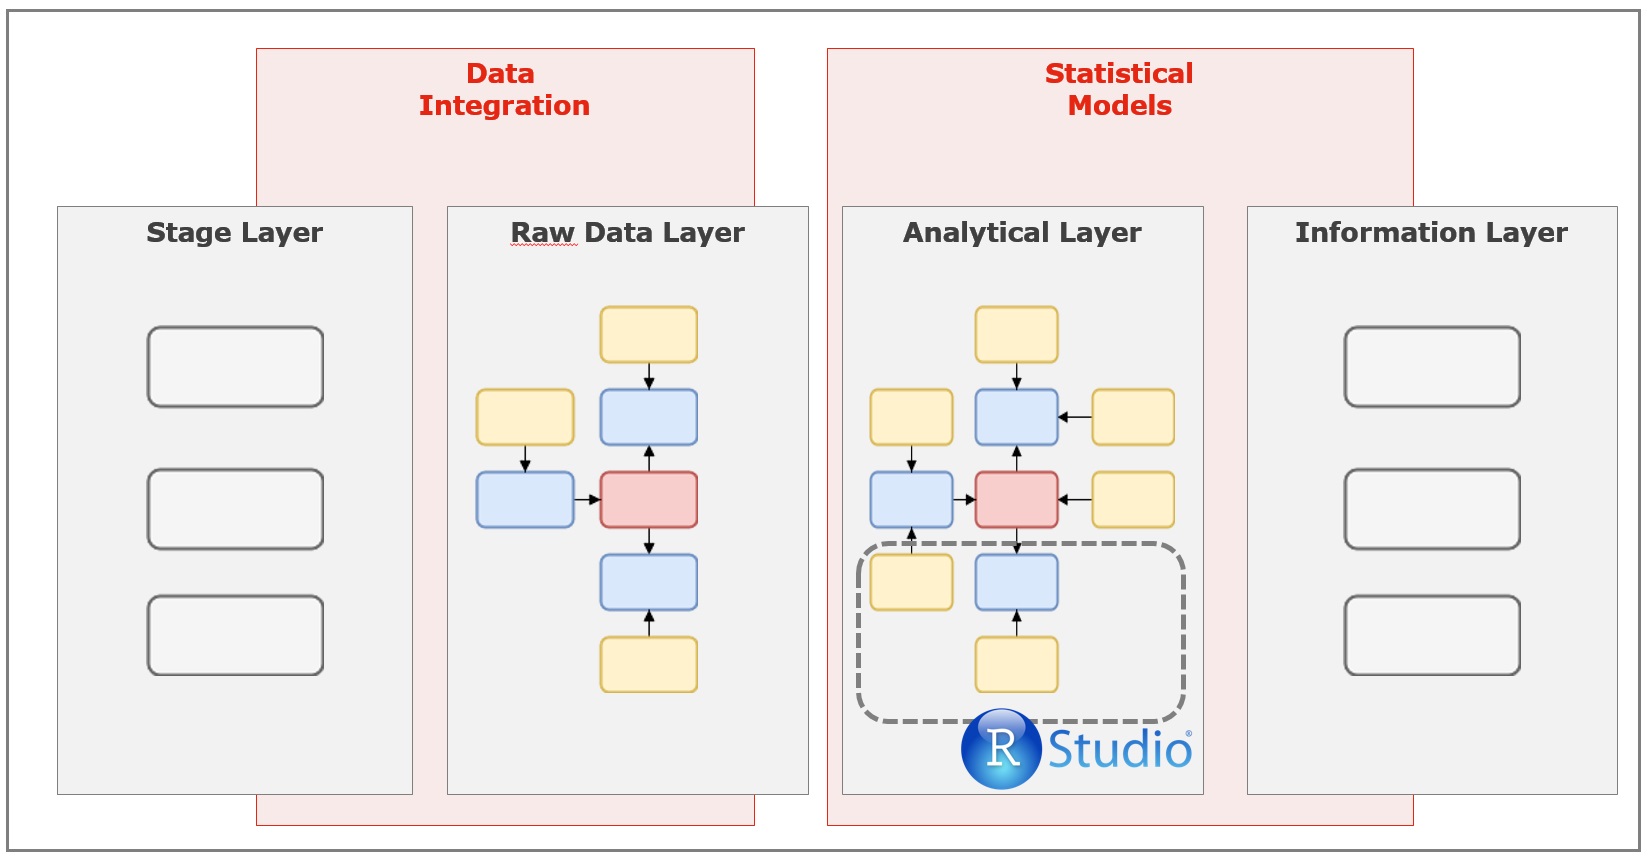
As the reference Data Vault 2.0 architecture my architecture consists of 4 layers:
- Stage Layer
- Raw Data Layer
- Analytical Layer
- Information Layer
The Stage Layer is the entry point of your data. The data of each data source you want to use is first stored at this layer. So that the data is available inside the database and can be pushed from one layer to the other. It acts as a kind of data source cache for the analytical system.
At the second layer, the “Raw Data Layer”, the data is integrated and persisted in a Data Vault data model. The data types of the different data sources and some other basic rules will be checked. Moving the data from layer 1 to 2 is implemented with ELT processes.
At layer 3 the “Analytical Layer” all the statistical magic happens. There you can calculate new performance features and execute predictive models, which both will extend your existing raw data model with new context.
Based on all the information created at the “Analytical Layer”, you can create all your needed reports in the “Information Layer”. These reports can be fixed queries, which list all possible bets you should play, as well as a adjusted data model to analyse your data with a data visualization tools like Tableau.

Agile
At layer 2 and 3 the data modeling methods of Data Vault 2.0 are used to model the data. Data Vault is relative new data modeling technique, which gets more and more used for Data Warehouses. It offers the potential for a real agile development inside of an analytical system.
Hint: I will describe data modeling with Data Vault more in detail in another post, where I write about how I implemented http://www.football-data.co.uk as the first data source of my analytical system.
In comparison to other data modeling methods (e.g. 3NF) Data Vault provides some clear advantages.
Pattern based loading:
In a Data Vault model exist only 3 different types of tables. Hub (Objects), Links (Relations) and Satellites (Context). Every type of table as the same structure and therefore can be loaded in the same way. That’s why building the ELT processes, which load the source data to the Raw Data Layer is very fast and easy.
Zero impact:
Data Vault follows a hard zero impact approach. That means that existing data structures and process need not be changed, if new data is added. This is extremely beneficial, while testing different performance figures at the Analytical Layer. Because of separation of objects (Hubs) / relations (Links) and the context (Satellites), you can easily extend your data model with new context / new features without the need to change something on your existing data model.
Sandbox prototyping:
Of course, you want to test a predictive model before you add it to your automated data processing. The R-SDK of Exasol offers me the possibility to directly write data to the database. So I can add the result of a prediction as new context to my existing data vault model. After that, I am able to use simple SQL statements to simulate my prediction against the historic odds of a bookie and determine, whether a model gains profit or not. A successful model can then be added to the default automated loading process.
Analytical
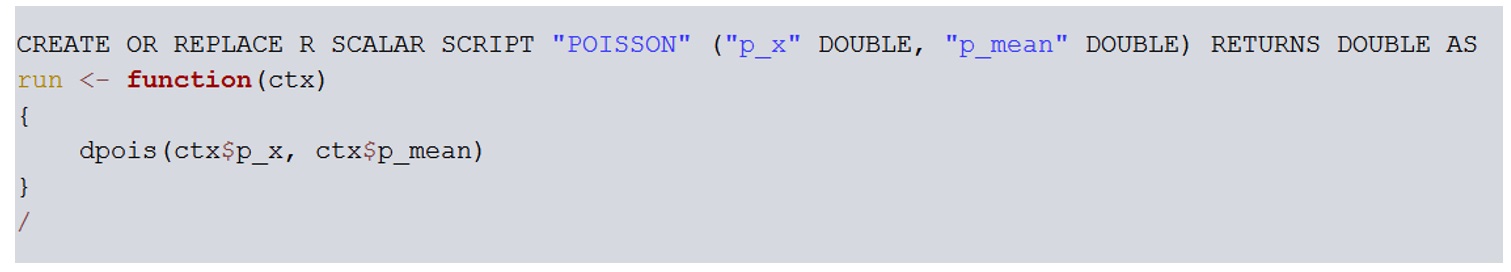
The main reason, why I decided to use R and Python as programming languages is very simple: The Exasol database offers the possibility to execute R & Python code inside the database.
You can write so called User Defined Functions (UDFs) in Exasol and then use this function inside SQL Statements. For advanced models like Forests, Regressions and Neural Networks the trained model can be stored at the file system of the database (EXABuckets) and loaded during the SQL execution.
That’s just great!
Advanced
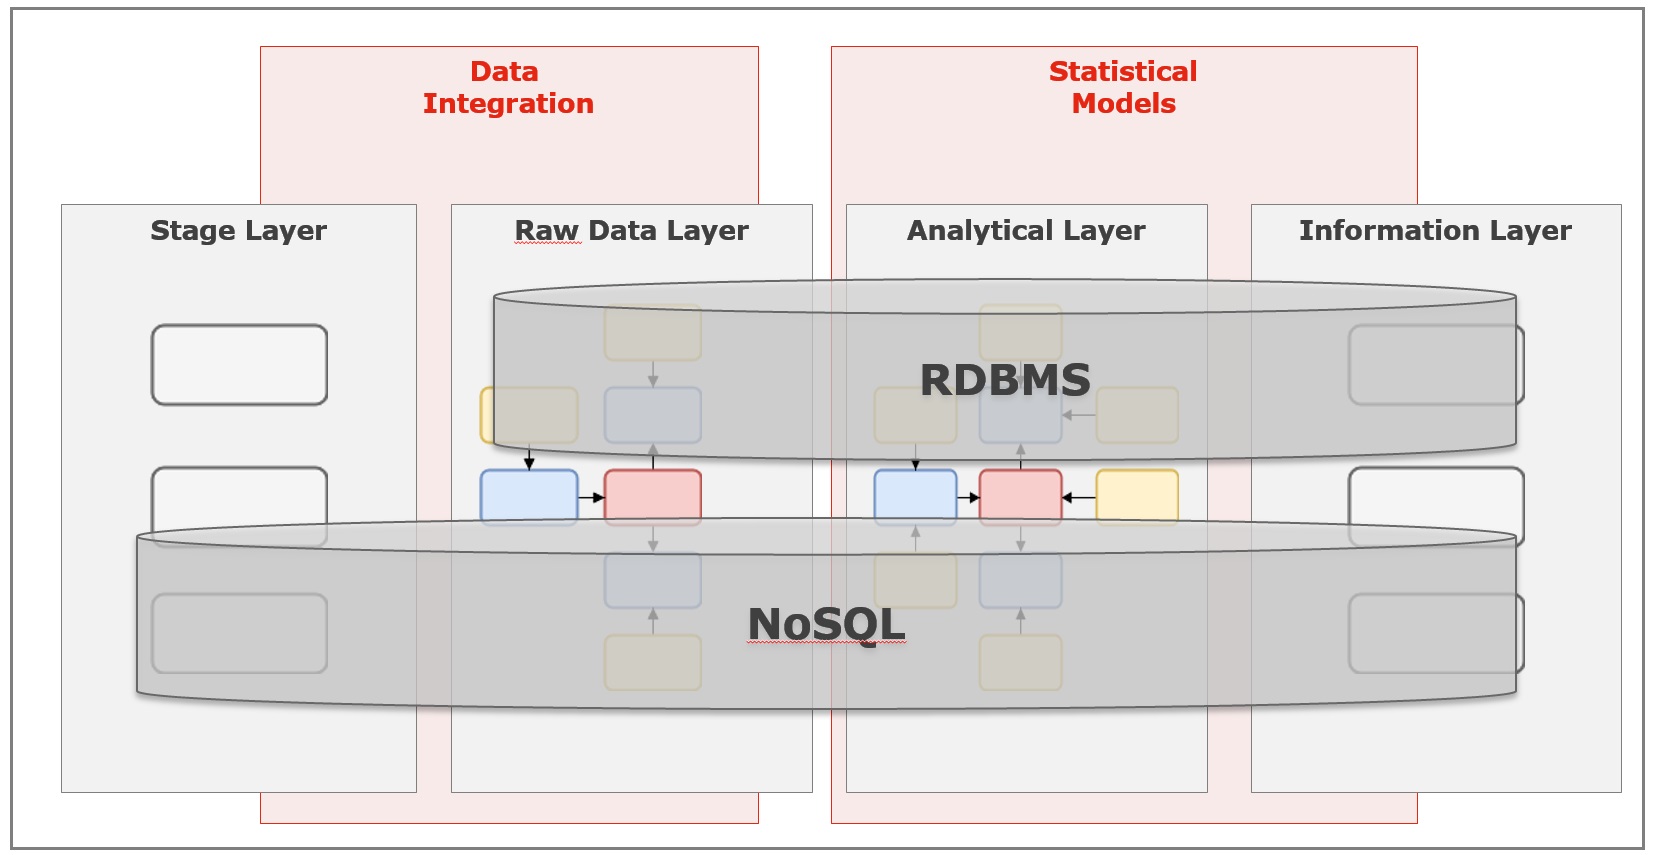
Data Vault 2.0 provides one big innovation in comparison to Data Vault 1.0. Hash keys are now used as the primary keys for the different tables. These hash keys are calculated based on the business key of your object (e.g. the team name). This is a big advantage compared to the usage of sequences. You can now e.g. spread your data model over different technologies and are able to combine e.g. a relation DBMS with NoSQL technology like a Hadoop cluster. So you are able combine structured and unstructured / semi-structured data.
I currently do not know, whether I need this. I am sure, I will mostly work with structured data. But it is definitely an advantage of this architecture.
One additional use case could also be to use a Hadoop cluster as the staging layer. So you don’t need too much think about the structure of your source data and just pump it in your storage. After that, you can use the schema-on-read functionality of Hive to build the interface to your Data Vault model in the Raw Data Layer.
This architecture is a great base to develop a predictive system for sports betting or just doing sports analytics. In further posts I will explain, how you can develop predictive models and how they are implemented at this architecture.
If you have further questions, feel free to leave a comment or contact me @Mo_Nbg.

4 Replies to “Analytical Architecture: TripleA DWH”