In the last post I described, how I collected the market value data as the first step of my journey. The second step is – in my opinion – one of the most important ones. Get to know your data! Of course many predictive methods can be used as a black box. But that’s something I would not suggest. At least you should understand how your values are distributed. And it’s even better, when you build some kind of domain knowledge. To know your data offers you the possibility to shorten the training process of you predictive models. And visualizations always help to better understand your data.
What defines the market value?
Let’s first think about, what influences the market value of a team? What increases the market value? The most obvious thing is money. Money helps to buy better and more expensive players. In order to get this money, you need an investor or sporting success. Each league distributes the broadcasting revenues based on the success of a team. The better a team, the more money it gets. And when a team manages to reach one of the foremost spots, it gets the possibility to get even more money. The international competitions offer a big amount of prize money for the clubs.
The Big 6 – Premier League
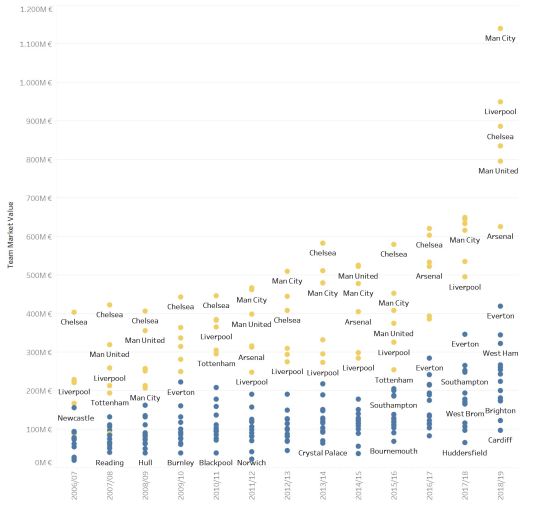
The Premier League is a good example for increasing market value through sporting success. For many years now – with the exception of the surprising Leicester season – the Premier League is dominated by the Big-6 (yellow).

And the market values confirm this. As the league table, the market value spread is lead by Big-6. Everton in some ways tries to challenge them. And then, there is the rest…
There’s only one Paris – Ligue 1
The Ligue 1 is a good example, how investor money helps to build a big club. In 2011 the Qatar Invenstment Group first started as majority later as a sole shareholder. And all the money they spent lead to a sporting success for PSG and a dramantic market value gap to the rest of the league. They were able to win 6 out of 8 league titles in this time.

Two outliners – Bundesliga
But such a visualization just tells us something about some specific teams. It’s hard to spot some information about the overall situation in a specific league. For such a visualization you could use a Boxplot. This helps you to identify, whether the market value are more or less symmetric.

The middle line in the box represents the Median. The market values in the last years were very non-symmetric. The poorer teams were closer together. While the market values of the richer teams were way more spread. In the current season the market values are again more symmetric, but the variation got bigger. Bayer Munich and Borussia Dortmund are outliers in this visualization. The market value for both teams is much higher than the league average. Such data points could cause problems as they lie on an abnormal distance to the rest of the data points.
Two different competitions – La Liga
Such outliers can have some extrem form. This reveals a look at the market values of La Liga. Barcelona and Real Madrid dominate this statistic for years. And Atletico Madrid now just joined this elitist club. And the rest of the league? It just looks like another division.

Juve above all – Serie A
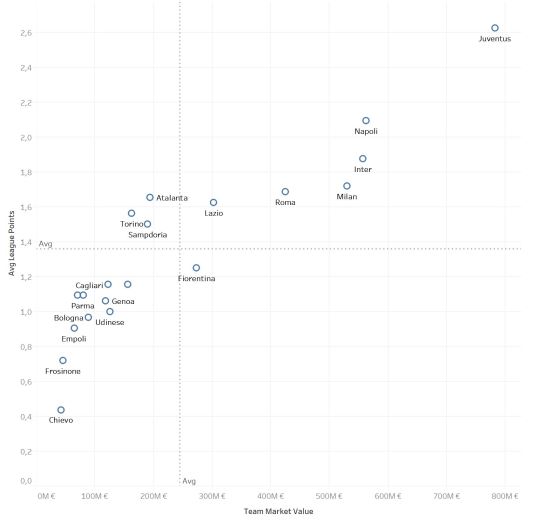
But does such a market value superiority also guarantees you more points at the end of the season? That’s basically the most import question, when you want to use some new data to improve your predictive model. By combining the market values with the gained points during the season, we get an estimation, how well a team can translate a monetary value into performance.

The visualization shows Juve dominating the market value statistic as well as the average points per game statistic. So they are using their potential and dominate the league. But you can spot also other things. Napoli got nearly the same market value as Inter. But they made much more out of the same amount of money. Overall the distribution of the teams reveals, that the market value indicates the capacity of a team. But whether the market value is really useful for predictions and correlates with overall win probability of a team will be the subject of the next part.
If you have further questions, feel free to leave a comment or contact me @Mo_Nbg.

One Reply to “”