
Of course I don’t write all these blogs and create the different models just for fun. Of course I am using my data and my models for betting. So I thought, it would be a good idea to explain my process of selecting bets based on my predictions.
Disclamer:
As in all other blog post, where I write about using my model results for betting, I have to stress again: The models alone do not ensure any profit. That was proved by multiple betting simulations. The provided predictions should just be used as an indicator.
Models
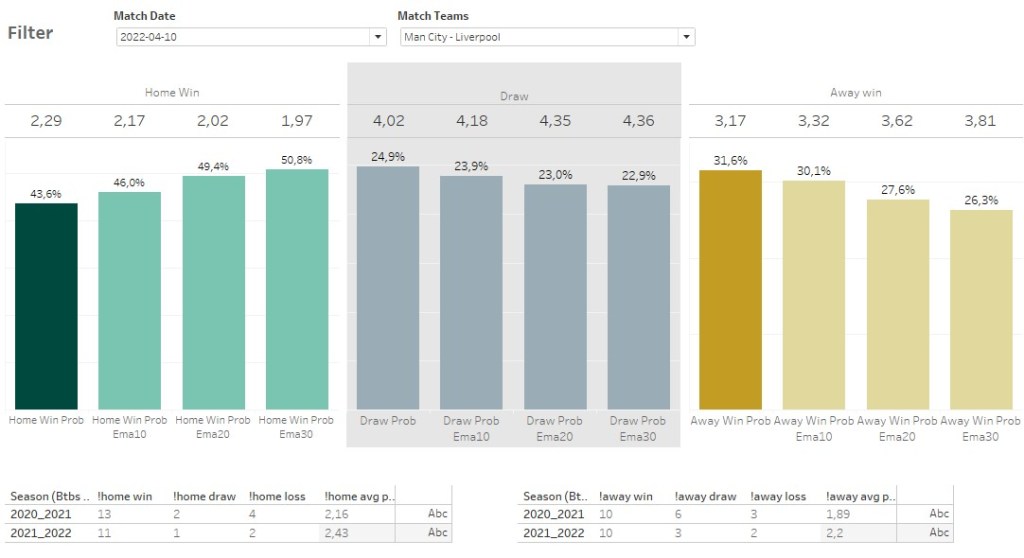
At first you need some numbers. Otherwise you are just gambling. For my bet selection I am using all my models, which I provide via RestAPI or via Excel files. Based on the data I created a betting dashboard. So I am able to first filter for all matches of a specific date and than have a look at a single match. All probabilities are already converted into odds, so that’s easier to spot interesting matches. Additionally I show the home respectively away performance for the last to seasons.
Model characteristics
Each model provides a different prediction for a match. So it’s important to know and respect the characteristics of the models. The most important models for my selection are the ZIP Poisson model and the EMA10 xG Vanilla Poisson model. Both showed a similar profit, when simulating a blind flat-stack betting. But they have really different characteristics.
| ZIP Poisson model | EMA10 xG Vanilla Poisson model |
|---|---|
| Goals | xG |
| 30 matches non-weighted history | 10 matches exponential weighted history |
| Adapted probabilties for 0 goals |
Both models provide a different perspective. We got one longterm model and one shortterm model. The other both models just provide some more context. But I more or less ignore them, when it’s about the bet selection.
Model interpretation
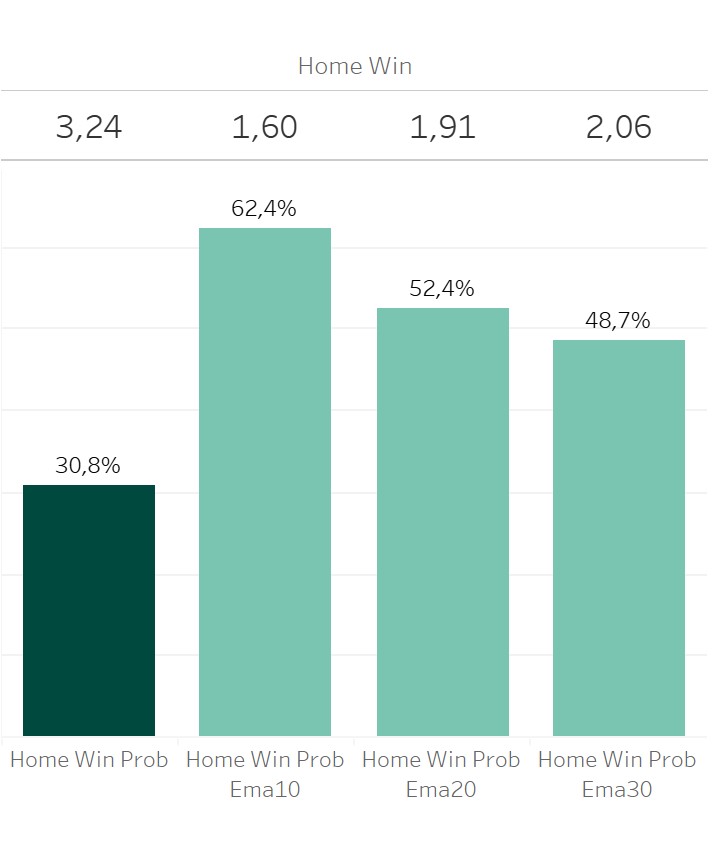
As I got 2 really different models, there can be different results for the prediction. A team might show a good short term performance. This often results in a way higher probability of the short term model. The decreasing probability of the mid and long term xG models indicate the same.
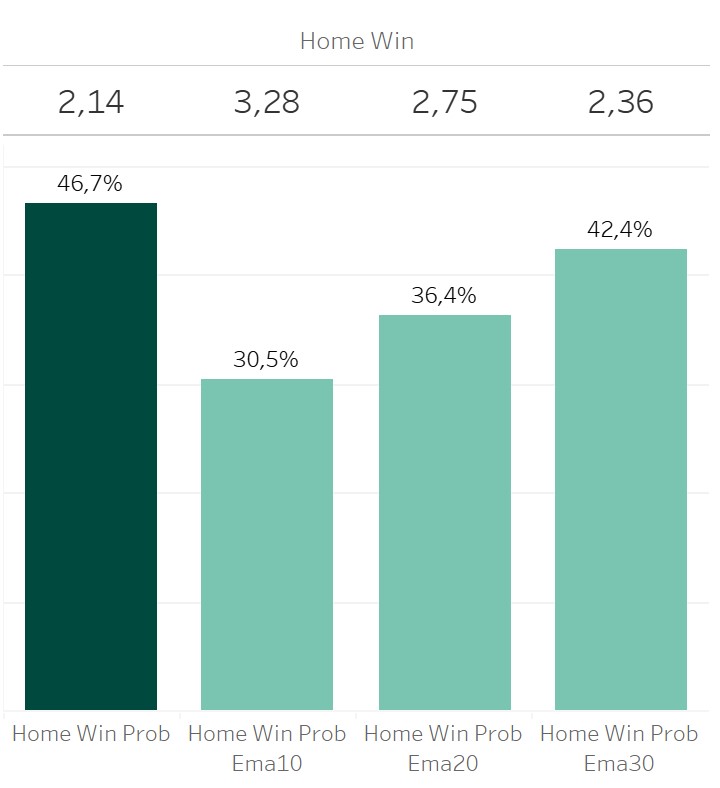
Of course a reverse picture is shown, when a team shows bad performance in the last matches. These are situations, which I often try to avoid. Short term performances tend to align to the long term performance after some time. This is called regression to the mean. But it’s hard to tell, when a short term model starts to overestimate the win probability of a team.
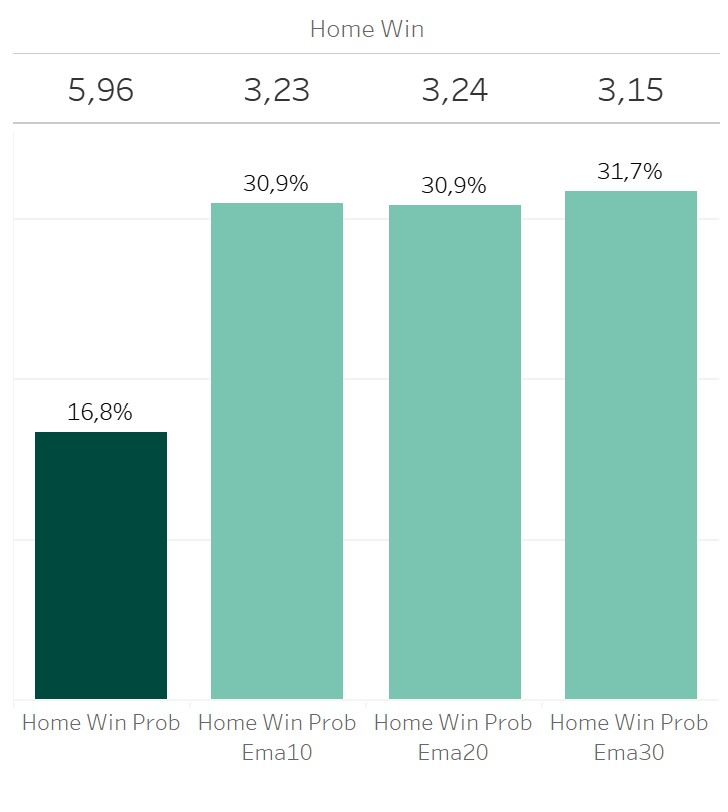
Another situation, which my models may indicate, is a difference between the quality of chances a team creates and the resulting goals. The short, mid and long term xG models show a similar probaility. So the team provides a constant performance. But the ZIP Poisson model indicates a way lower win probaility. That’s caused by a discrapancy between goals and xG. A team scores less goals than expected by the quality of chances or concedes more goals than expected. Such matches might also be critical, as a team could take there chances in the next match.
Bet selection
For the bet selection I try to avoid such unclear situations. Ideally all models provide a similar prediction, while the ZIP model and short term xG model are the most important ones. If I spot a match, where a bookie provides a higher odd than indicated by these two models, this match is a good candidate for a bet. As a last step, I just check, whether there are other circumstances, which might have an effect on the market odds, but are not part of my models:
- Injuries or suspensions of important players
- Exhausting mid week matches during the week
- Special rivalries, derbies
Putting all this together and having no more doubts, let’s me place a bet. Does this ensure a profit? No, as still personal evaluations are part of the bet selection. But using numbers as a base for the bet selection, helps me to have a more or less rational bet selection and to not just gamble.
If you have further questions, feel free to leave a comment or contact me @Mo_Nbg.
