
“What’s the best model?” – That’s a very important questions, when creating, training and testing new predictive models for football. Various machine learning algorithms and packages offer by default a set of scoring functions like accuracy, log-loss, brier score or ROC-AUC, which measure the accuracy of a probabilistic prediction. But I already recognized in older posts, that the best model based on a scoring function, was not always the best model, when it’s about using the prediction results for betting. So let’s have a look and compare the rank of some scoring functions in comparison to the betting profit of some models.
Betting models
Info:
If you not yet read any of my older posts and wonder about the profit results: The main perpuse of the models was to show different model implementation
Update 19.04.2022:
While working with the data for a new blog, I recognized an error in my reports for the betting simulation. The wrong odd was used for the away bets. In the 1st version the Vanilla Poisson models performed worse than the other models. After correcting the error the Vanilla Poisson models performed best. But this has no influence on the final conclusions. Still no scoring function represented the same ranking.
Ok, so first we need some models. For this test I will again reuse my models from older posts. The Zero-inflated Poisson model based on goal data. 3 different Vanilla Expected Goal (xG) Poisson models with different time windows. And last but not least the XGboost machine learning model, which I introduced in my last post.
| Model name | Characteristics |
| ZIP | – 30 matches average goal features – home & away performance seperated – Zero inflated Poisson Distribution |
| Vanilla xG Poisson EMA10, EMA20, EMA30 | – 10/20/30 matches exponential moving average xG features – home & away performance seperated – Poisson distribution |
| XGboost EMA15 | – 15 matches exponential moving average xG & advanced stats features – home & away performance combined – machine learning algorithm (XGBoost) |
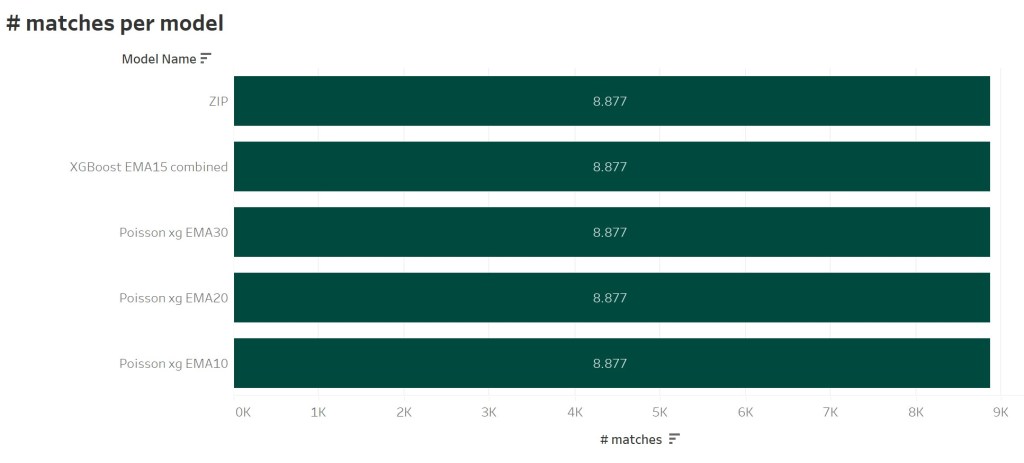
For the test I used matches of the Big-5 Leagues (Premier League, Bundesliga, LaLiga, SerieA and Ligue 1) between the seasons 2016/17 and 2020/21. Additionally there have to be predictions of each model for each match to ensure a consistent betting result. So we got a base of overall 8.877 matches for each model.
Betting profit
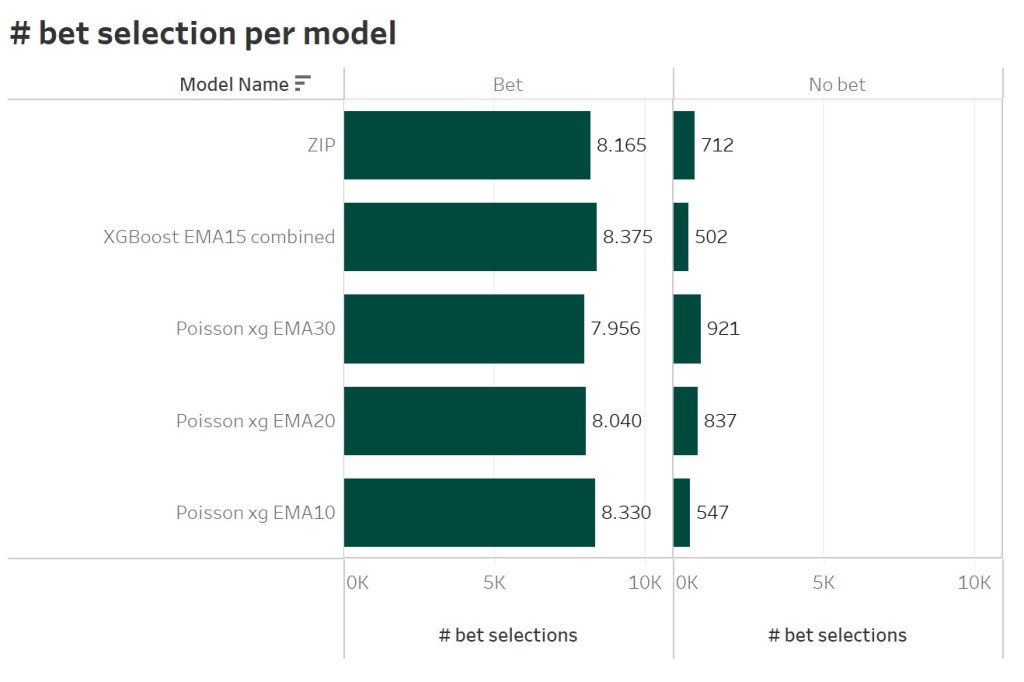
At first, we take a look at the betting profit rank. This is the most important rank, when it’s about the performance of a predictive model. To calculate the betting profit, I simulated an automated betting. Based on Bet365 market odds and the predicted probability for each match I determined, whether there is value for a single bet on the 1×2 market. For each match only one bet is selected, even if e.g. the Draw and Away win odds seem to offer value. This results in a different bet selection for the different models. The ZIP model determined value in 8.165 different matches. 712 matches did not show any value in any market.
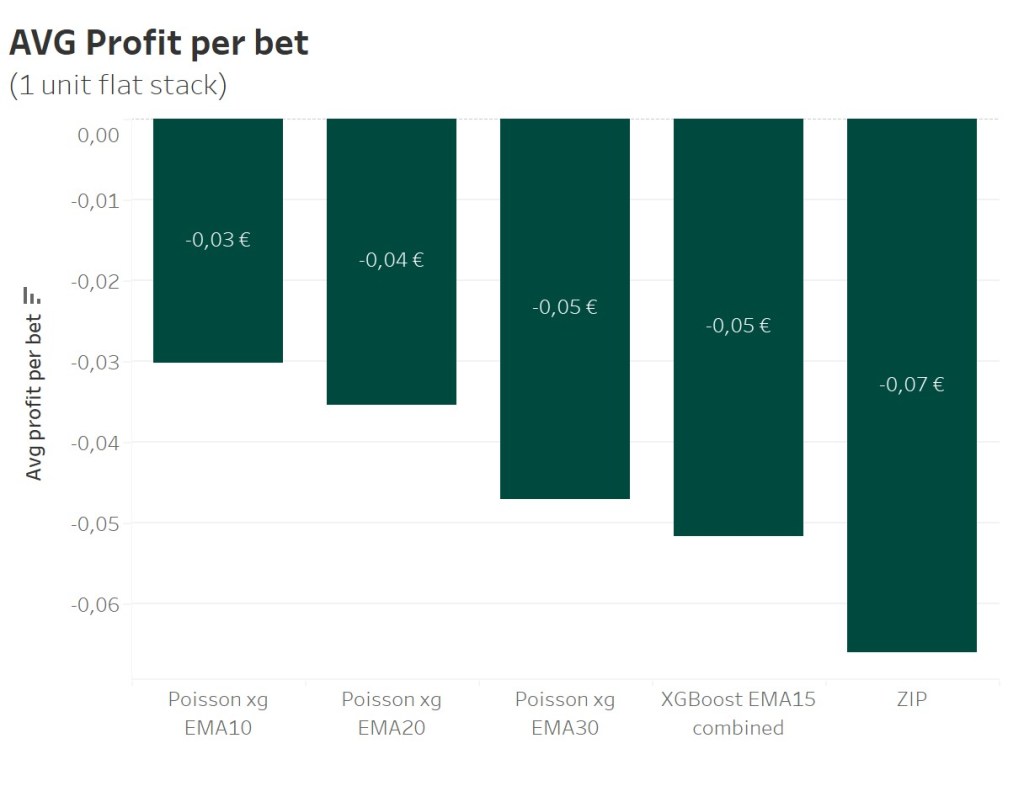
All selected bets are played as a 1 unit (1€) flat stack. Over a course of 8.375 matches the shorterm Vanilla Poisson model shows the best performance with an average loss of -0,03€ per bet. The midterm and longterm Vanilla Poisson model follow. With 8.165 bets and an average loss of -0,07€ the ZIP model performs the worst.
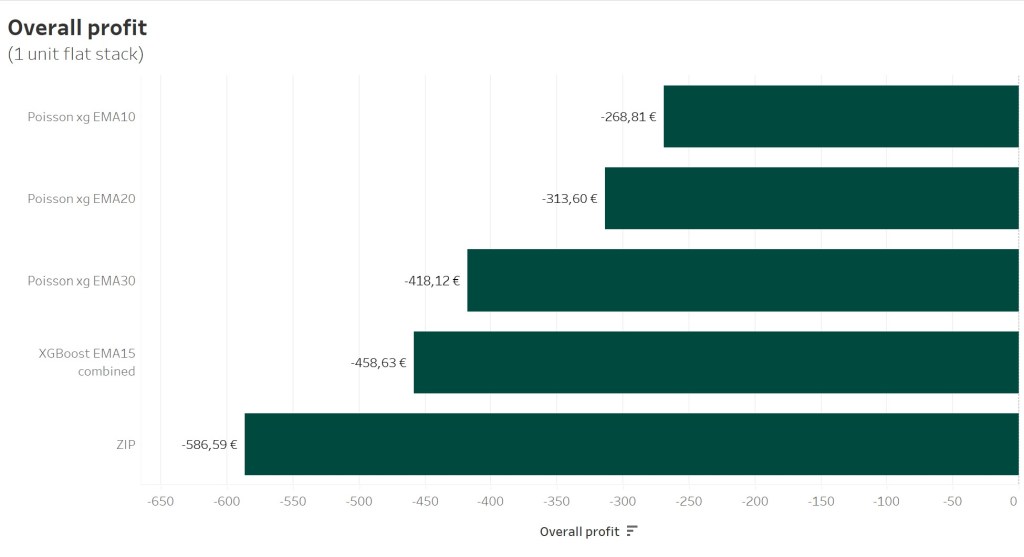
The overall profit looks the following. An overall loss abot -268,81€ after 5 years of simulated betting looks not too bad, do be honest.
When now measering the performance of models via scoring functions, I would now expect the same ranking. But as older articles already indicated, that’s not the case. So let’s have a look at different scoring functions, whether they at least provide a similar ranking.
Scoring functions
Scoring functions or scoring metrics provide a measure for the performance of a predictive model. You can differ between 2 kind of metrics: The accuracy provides the information how often a model was able to predict the correct class or how many errors the model made on the given data. In comparison Log Loss provides the information how big the error for predictions was.
This also leads to the fact the accuracy & loss do not correlate:
- A low accuracy and a low loss indicate little but a huge amount of errors
- A low accuracy and a high loss indicate a huge amount of big errors
Accuracy
The accuracy of a model provides the ratio of correct predictions in comparison to the overall amount of predictions. The correct predictions are also called True Positives (TP). The TPs can be determined by creating a confusions matrix based on the prediction results. Following pictures show the different confusion matrices for each model.
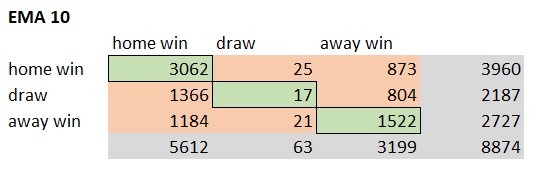
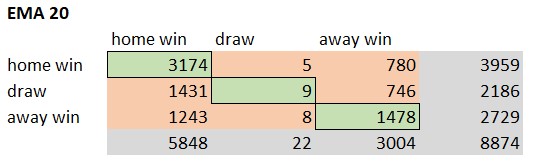
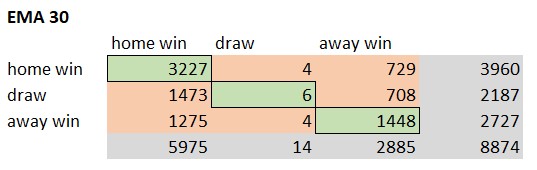
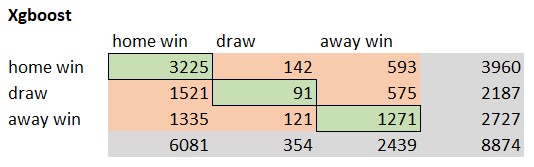
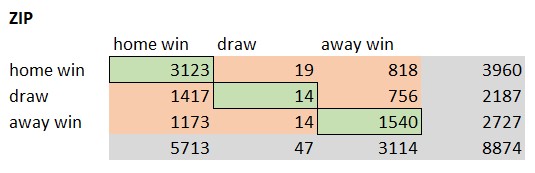
The green elements of the confusion matrix represent the True Positive cases. The model predicted the result correct. The Vanilla Poisson xG EMA 30 model predicted 4681 matches correct. That’s an accuracy of 52,7%. The XGBoost model only predicted 4587 matches. Following picture shows the ranking based on the model accuracy.
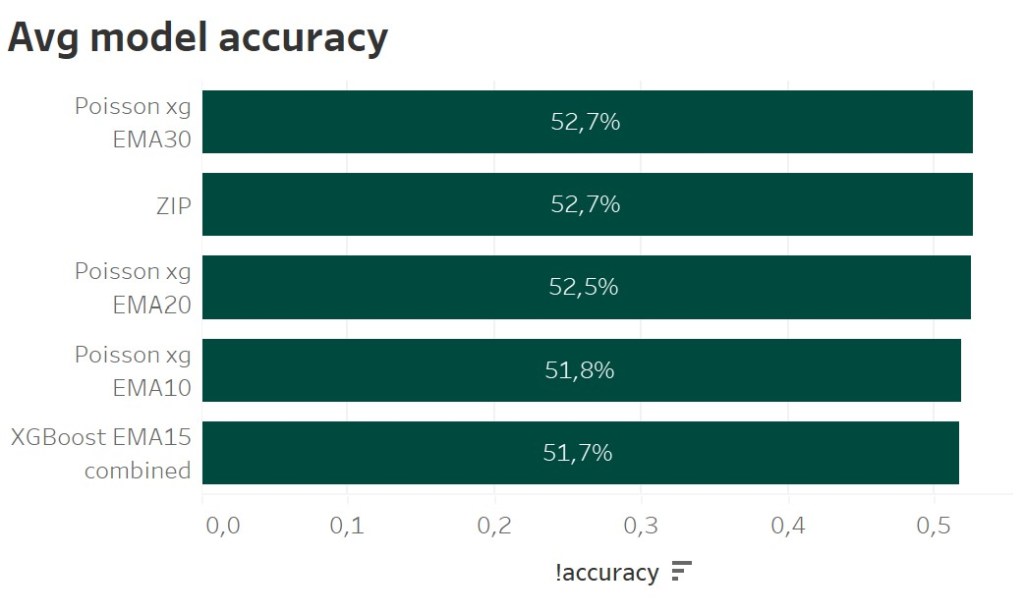
The best model, when it’s about the profit, has got the lowest accuracy. The ZIP model, providing the 2nd best overall profit, has got the 2nd best accuracy. That should be enough to understand, that a predictive model, which is able to better predict the correct result in comparison to another model, does not automatically also provide a better betting profit.
Brier Score
The Brier score is the metric, I am using all the time as a model performance indicator in my other posts. The Brier score basically represents the mean squared error for all the predictions. So the bigger the error, the more it get’s weighted. And as the Brier score represents a loss function, the lowest Brier score represents the best model.
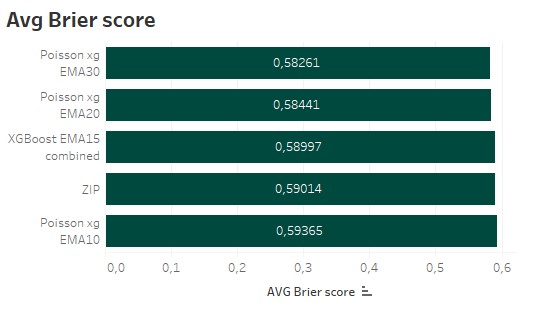
The shortterm Vanilla poisson model as the most profitable model has got the worst Brier score. The 2nd best and 3rd placed model, regarding the profit, are the best models based on the Brier score.
Log Loss
Similar to the Brier score Log Loss is also a loss function, which should be as small as possible, when training a model. It also quantifies the error between the predicted values and the real outcome. But instead of the mean squared error, the negative log is used.
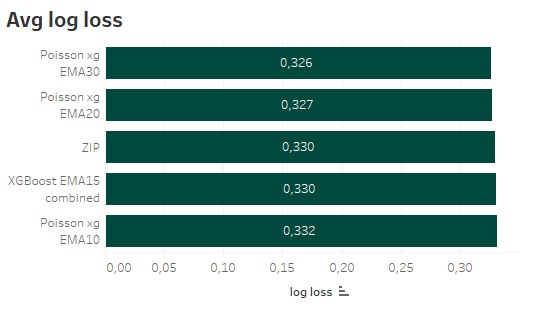
The ranking for the Log Loss looks really similar to the Brier score. So minimizing the error of the predictions does not automatically provides the best profit, when betting against a bookie.
Conclusion
The different examples proved, what I already suspected. Known scoring metrics do not correspond with the optimization goal of a betting model. It’s not about guessing the most football matches right. It’s also not about having the lowest error for the predicted probabilities for single markets. A betting model has to be able to provide the maximum profit, when betting against a bookmaker. The model has to be able to spot gaps in the market. If you possess the necessary coding skills, this could be solved via a custom loss function. Otherwise you just have the option to simulate as much models as possible to find the best version.
If you have further questions, feel free to leave a comment or contact me @Mo_Nbg.
References:
https://towardsdatascience.com/machine-learning-for-sports-betting-not-a-basic-classification-problem-b42ae4900782
https://machinelearningmastery.com/how-to-score-probability-predictions-in-python/
Metrics for multiclass classification – https://arxiv.org/pdf/2008.05756
https://www.vantage-ai.com/blog/beating-the-bookies-with-machine-learning

2 Replies to “Scoring functions vs. betting profit – Measuring the performance of a football betting model”